Fudd:
I think you hit the mark on that one. Or at least that is how it seems for me.
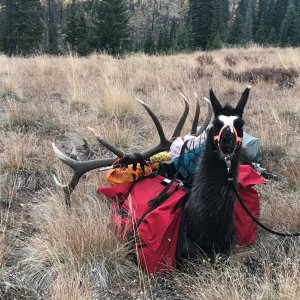
Last year, my son and I applied with an average of 5 points. Our last choice was archery 61-68.
If you look at the chart, you would think it is nearly impossible not to draw with 5 points, when NV squares your points, giving us 26 chances to get a low random number.
But here is the draw odds you would get by looking at the their chart.
6 points - 100%
5 points - 100%
4 points - 100%
3 points - 75%
2 points - 50%
1 point - 4.5%
No points - 0%
Since we used this as our final choice and did not draw, I know we are not on that list.
So, our application does not even show up on their chart, as we did not draw. There could have been a lot of guys with even more points than us who did not draw, and they would not show up on the chart either, unless it was their first choice.
Like you, I suspect the odds in NV are way worse than is published in that chart, and much worse than the odds published by the services.
And given how difficult it would be to actually predict odds with the little bit of data NV provides, I don't think any of the services will be able to provide odds that are specific. The best use is for the general idea of what units seem to be the most in demand, but beyond that, not much can be taken from that chart.
"Hunt when you can - You're gonna' run out of health before you run out of money!"
")